Gas Chart Imaging
Serving the Appalachian Basin Since 1970
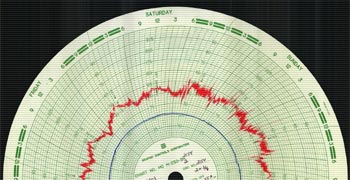
Chart images, and the way things used to work...
Once a chart leaves the meter itself and is shipped to a chart processing company, it's often not seen again (or not easily seen) by the producer. In some cases, this can cause real problems. However, if you're a client of R L Laughlin, that's a problem that you no longer have to think about.
Bridging the gap between paper and digital
Enough Is
Never Enough
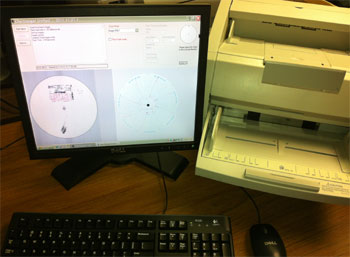
We have implemented a process that allows us to create high quality digital images of every gas chart that we process.
From high-end scanning equipment to custom gas measurement software applications, our dedication to go above and beyond for the client is no more obvious than in our efforts to scan, identify, catalogue, and store an image of each natural gas chart that enters our facility.
We image every meter test report, meter test chart, and gas analysis report that we receive.
View high quality images of your meter testing results online with the simple click of a mouse.
Compare gas volume data alongside real-world images on our web portal to verify our work.
We can place copies of images on a removable storage drive and ship them directly to your facility.
Natural gas charts can be torn, stained, or lost. When you bring your business to us, access is assured, even if the actual paper chart cannot be found or is destroyed at a later date.
High Resolution Scans
Web Portal Integration